Note
Go to the end to download the full example code.
As-designed vs as-scanned deviation#
A real reverse-engineering question: a vendor ships a nominal CAD model of a part, and a depth camera reconstructs the part that actually arrived. Where, and by how much, does the as-built surface deviate from design?
This example uses two real models of the same physical object from the T-LESS dataset (Hodaň et al., WACV 2017, CC-BY 4.0): a manually authored CAD model and a model reconstructed from Primesense RGB-D scans. Both are in millimetres in a shared frame. We rigidly align the scan to the CAD nominal, then color the scan by signed distance to the design surface, the first-cut incoming-quality metric.
import numpy as np
import pandas as pd
import pyvista as pv

import pyvista_cad  # noqa: F401  # registers the .cad accessor
from pyvista_cad.examples import downloads
Load the as-designed CAD model and the as-scanned reconstruction.
/home/runner/work/pyvista-cad/pyvista-cad/examples/05_workflows/as_designed_vs_scan.py:31: PyVistaFutureWarning: The default value of `algorithm` for the filter
`PolyData.extract_surface` will change in the future. It currently defaults to
`'dataset_surface'`, but will change to `None`. Explicitly set the `algorithm` keyword to
silence this warning.
  design = pv.read(cad_path).extract_surface()
The scan carries vertex RGB and normals from the RGB-D reconstruction: real sensor data, not a perturbed copy.
Rigidly register the scan onto the CAD nominal. Real scans land in an approximate pose; the deviation is only meaningful after an ICP alignment removes the residual rigid offset.
scan = scan.align(design)
scan
Compute deviation: signed distance from each scan point to the CAD surface.
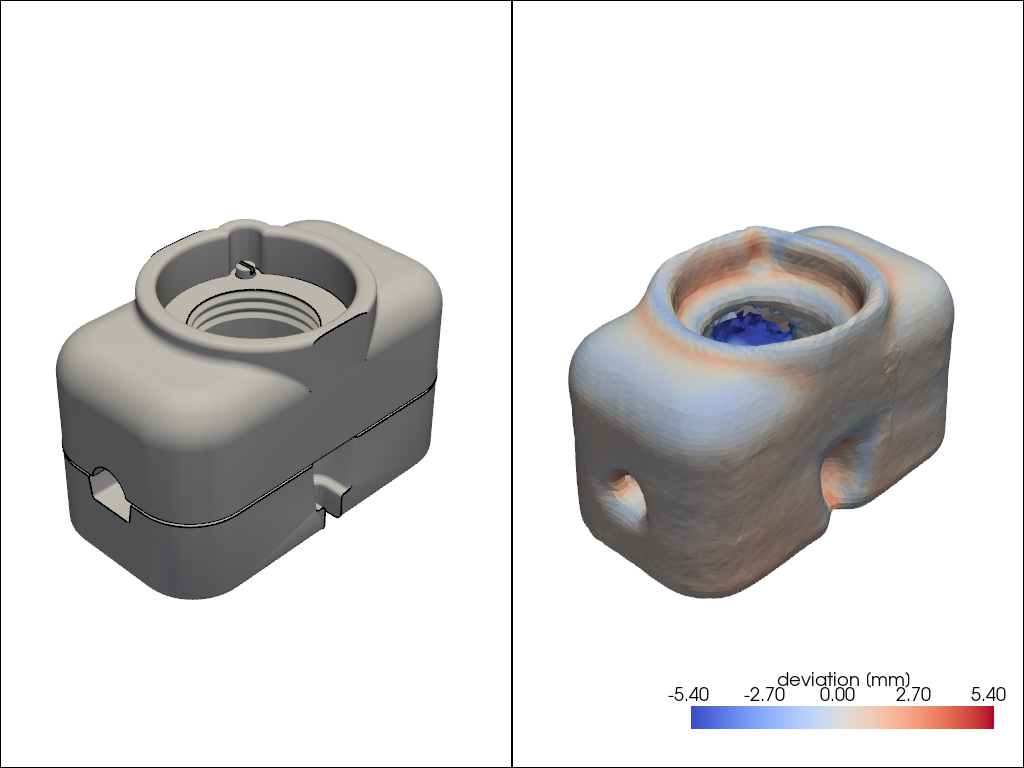
Side by side: the as-designed CAD on the left, the registered scan colored by signed deviation on the right. Red is proud of nominal, blue is below it; the bulk of the surface is within scanner noise, with clear excursions where the reconstruction is incomplete.
clim = float(np.percentile(np.abs(dev), 95))

pl = pv.Plotter(shape=(1, 2))
pl.subplot(0, 0)
pl.cad.add(design, color='lightgray')
pl.subplot(0, 1)
pl.add_mesh(
    scan,
    scalars='implicit_distance',
    cmap='coolwarm',
    clim=(-clim, clim),
    scalar_bar_args={'title': 'deviation [mm]'},
)
pl.link_views()
pl.show()
Total running time of the script: (0 minutes 1.011 seconds)